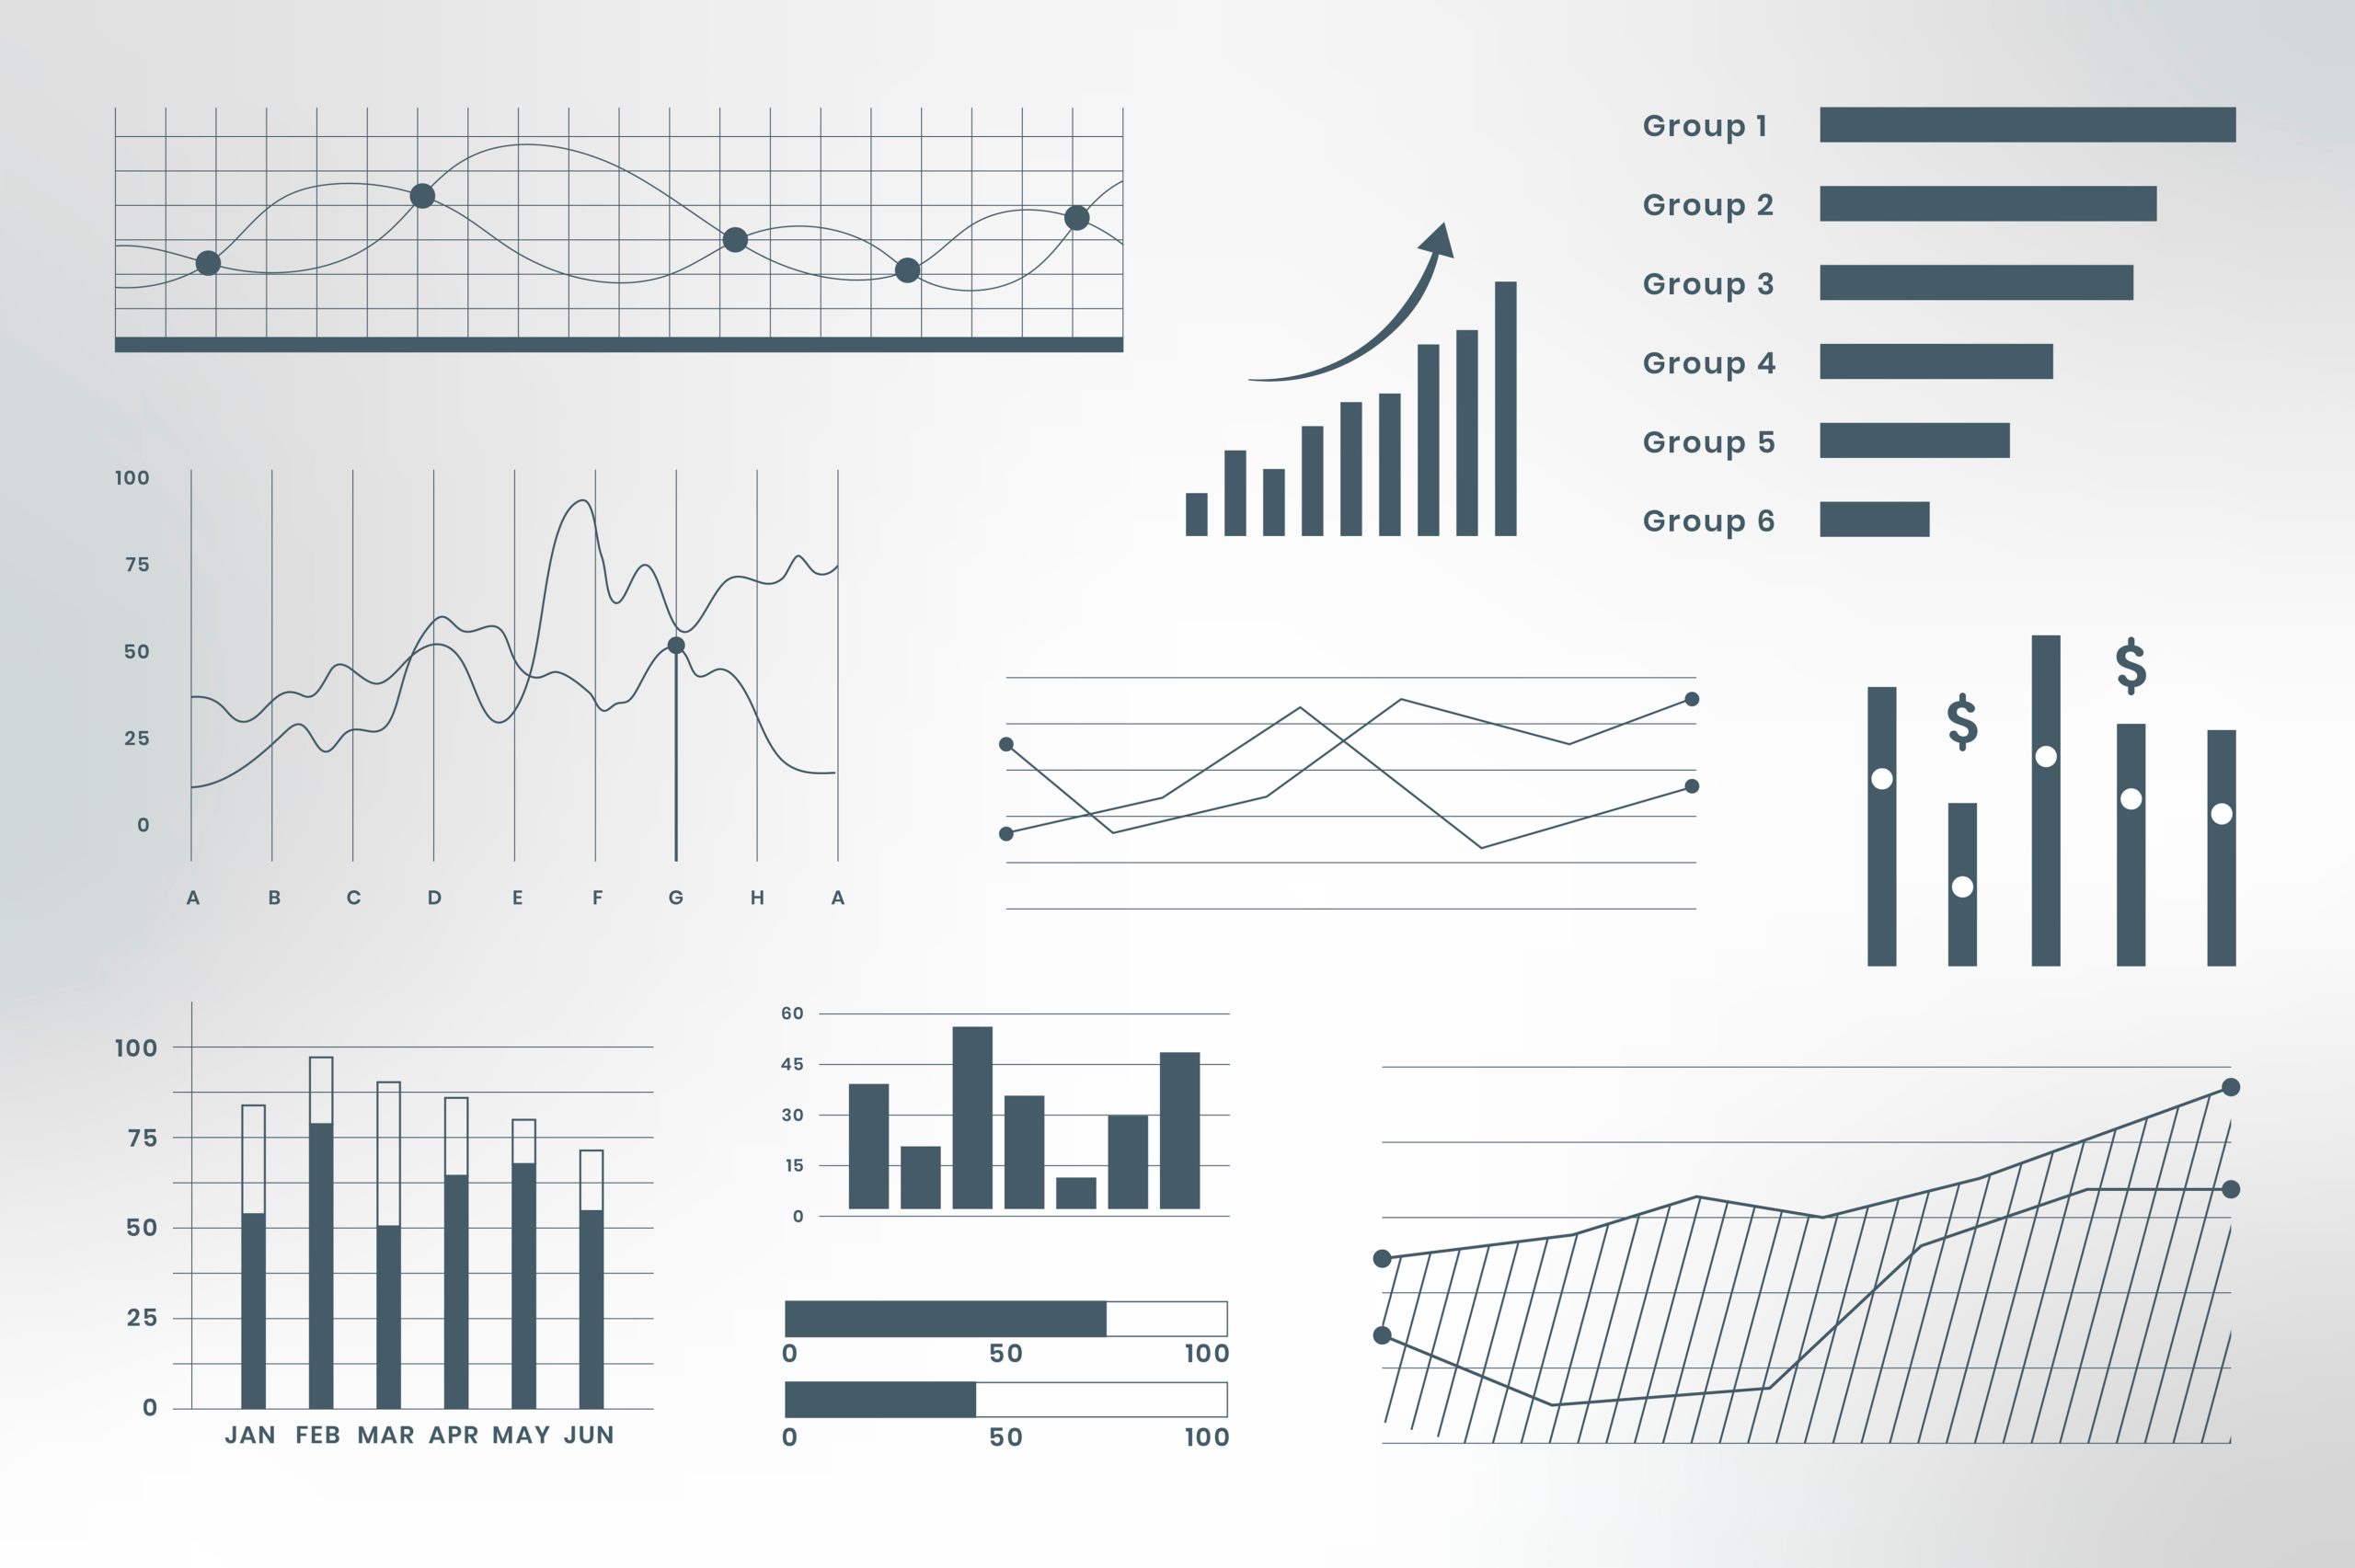
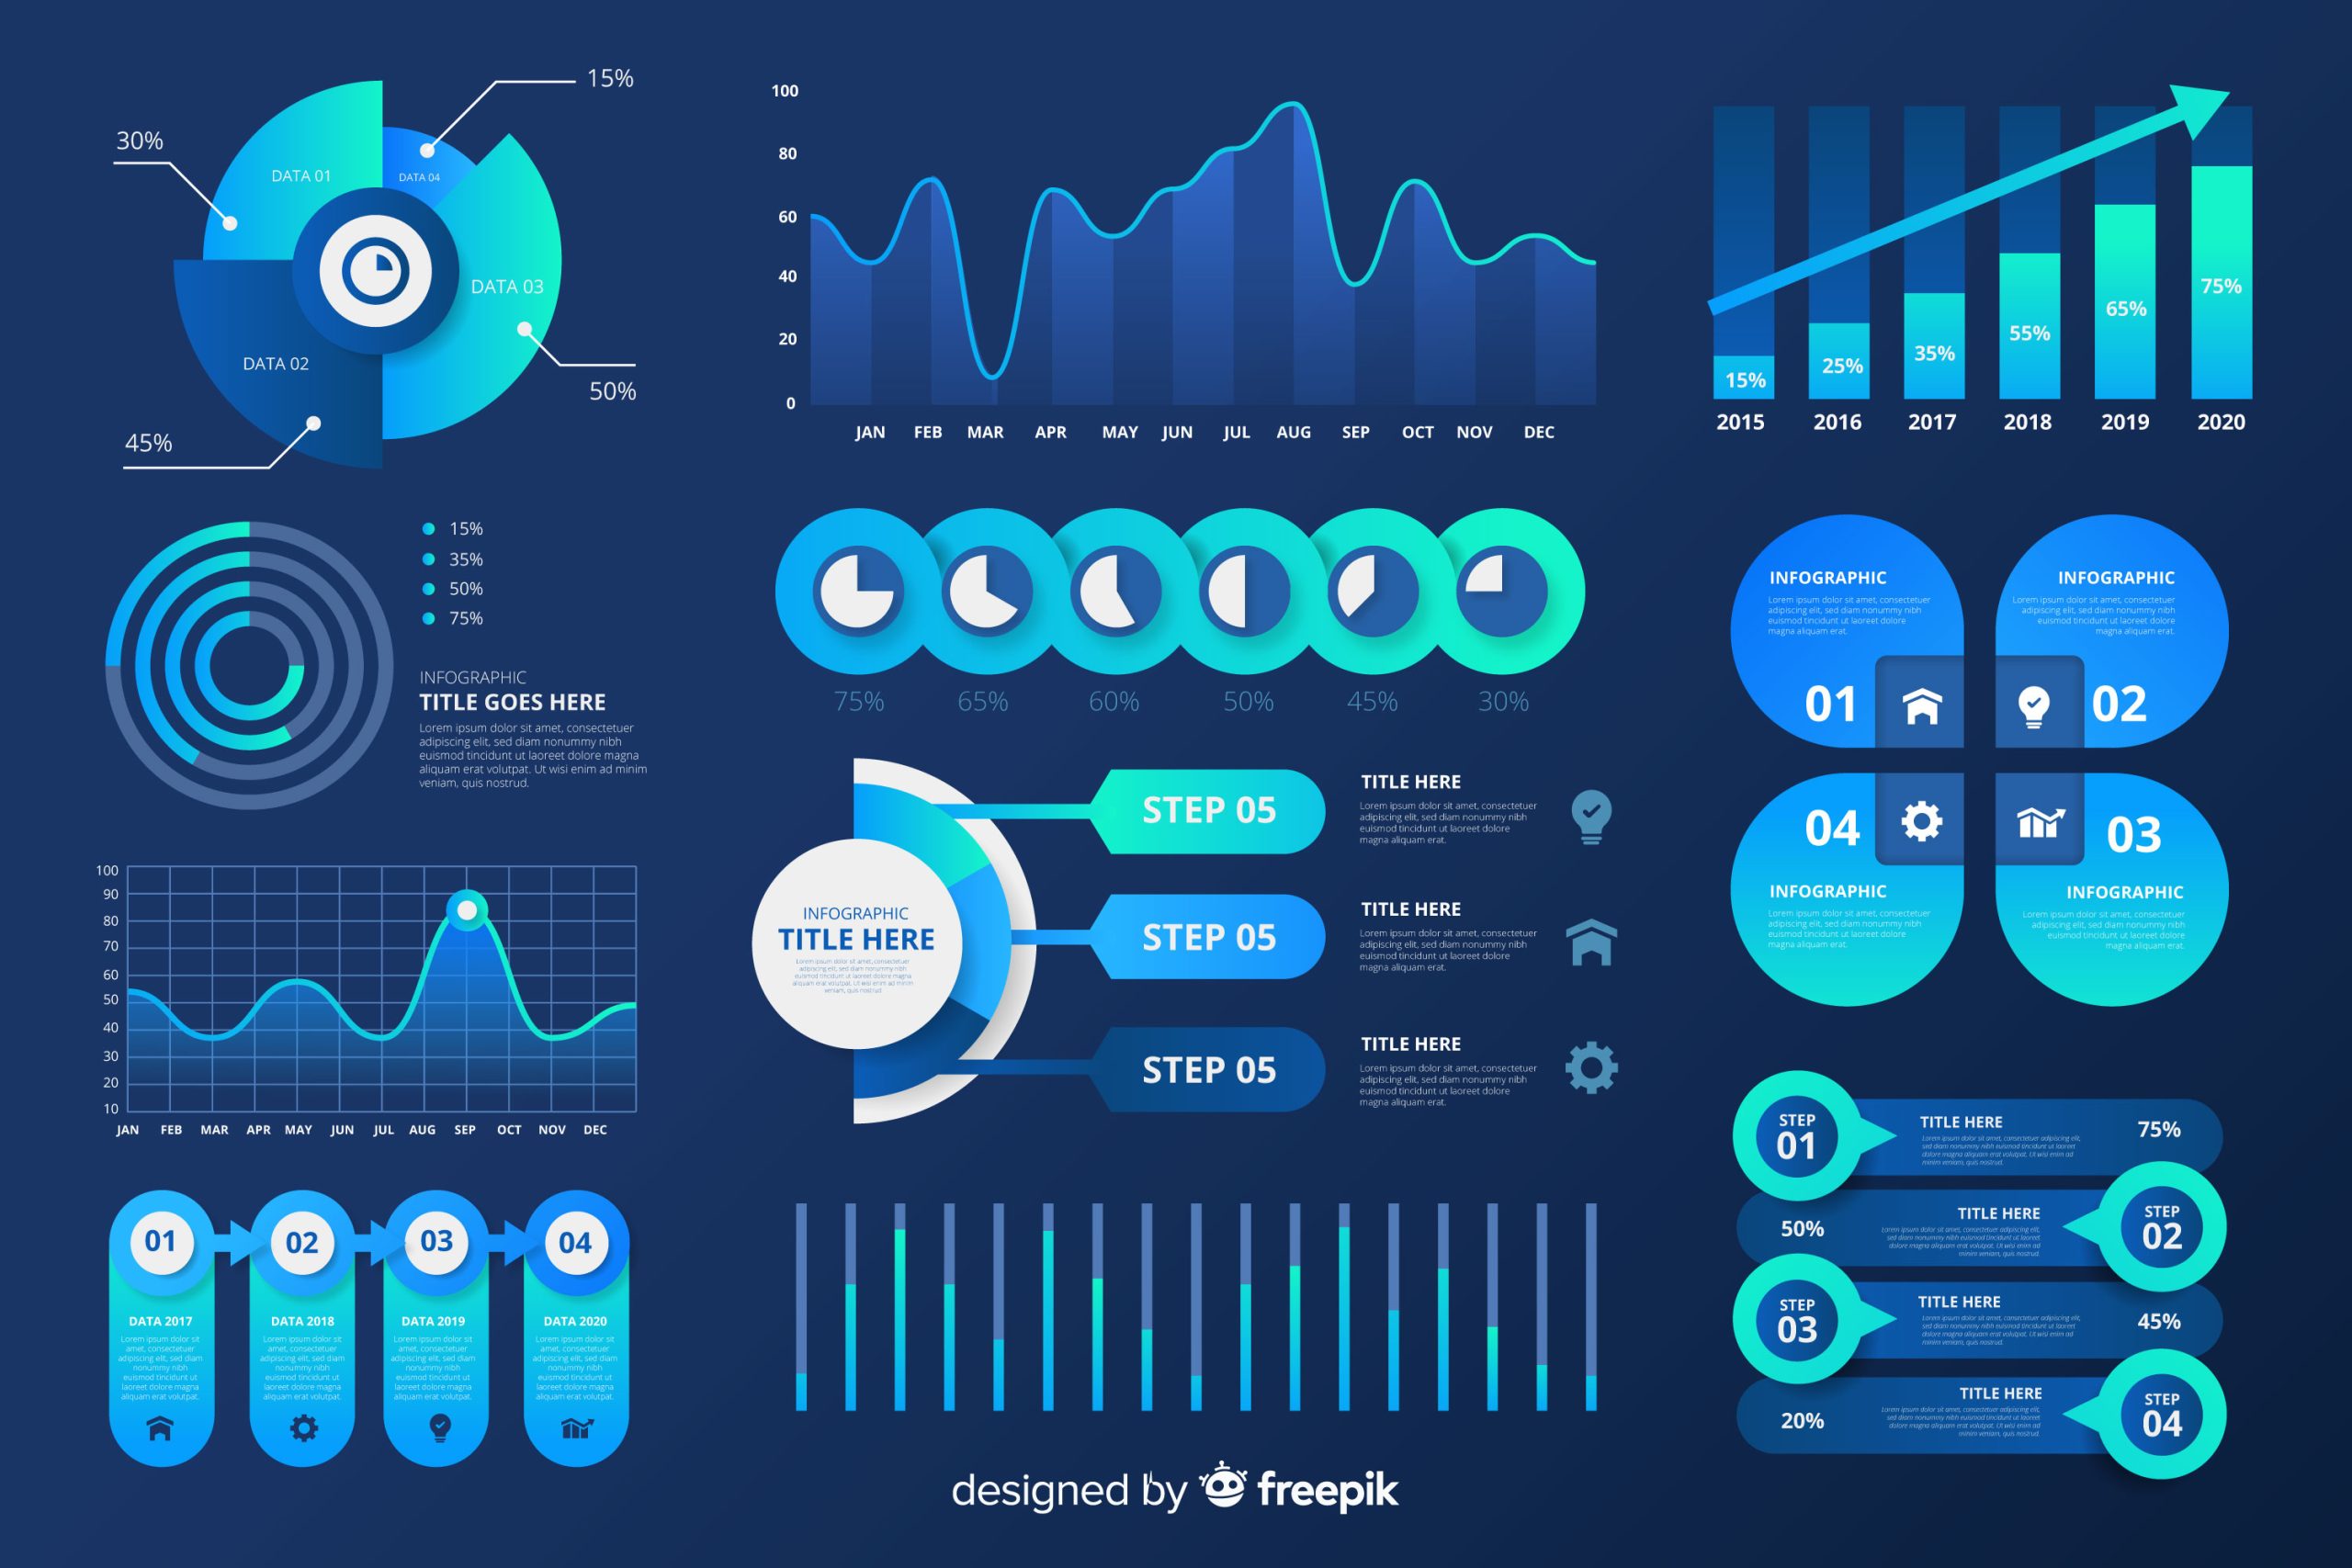
In the modern business world, analyzing and interpreting data accurately and quickly and presenting these interpretations through dashboard reports is a critical element for businesses to gain competitive advantage.In this process, dashboard reporting systems play a significant role. Dashboards accelerate decision-making processes by visually presenting businesses’ data, making them faster and more effective. In this article, we will explore what dashboard reporting is, how it benefits businesses, and examine best practice examples.
What is Dashboard Reporting?
Dashboard reporting involves presenting information gathered from various data sources using graphs, tables, and other visual tools on a single screen. This allows users to instantly view and analyze important metrics and KPIs (Key Performance Indicators). Dashboards transform complex data sets into understandable and actionable information, supporting businesses in making strategic and operational decisions.
Benefits of Dashboard Reporting
- Quick and Effective Decision Making: Dashboards provide real-time data presentation, enabling users to make quick and effective decisions. This helps businesses quickly adapt to dynamic market conditions.
- Visual Analysis and Interpretation: Visualizing complex data sets helps users understand data more easily. Graphs, tables, and other visual tools assist in quickly identifying data trends and anomalies.
- Customized Reports: Dashboards can be customized to meet user needs. Each department or user can create and monitor reports tailored to their business requirements.
- Data Integration: Dashboards can integrate multiple data sources, providing businesses with a comprehensive and holistic view of their data.
- Real-Time Updates: Dashboards reflect changes in data sources instantly, ensuring users always have access to the most current and accurate information.

Best Dashboard Practices
- User-Centered Design: Dashboards should be designed according to user needs. Identify what information your audience requires and make this information easily accessible.
- Simple and Understandable Visuals: Avoid complex and overloaded visuals. Use simple, clear, and understandable graphs and tables to facilitate data comprehension.
- Effective Use of Color: Use colors judiciously. Colors can be used to highlight data and emphasize important information, but excessive use of colors can lead to confusion.
- Real-Time Data: It’s important for dashboards to provide real-time data to ensure users always have access to the latest information, aiding in making more accurate decisions.
- Interactive Features: Incorporate interactive features into dashboards, such as filters, search boxes, and drill-down capabilities, allowing users to explore different data sets and conduct detailed analyses.
Dashboard reporting enables businesses to analyze their data more effectively and make strategic decisions. A well-designed dashboard simplifies the interpretation of complex data and enhances business performance. Exploring dashboard solutions for your data analytics and reporting needs will give you a competitive edge and enable informed decision-making. Harness the power of visualizing and analyzing data instantly to make more informed and effective decisions.
You can also check out our article on The Importance of Reporting and Risk Reports.
