Subtotal ₺0,00
Sembol BI

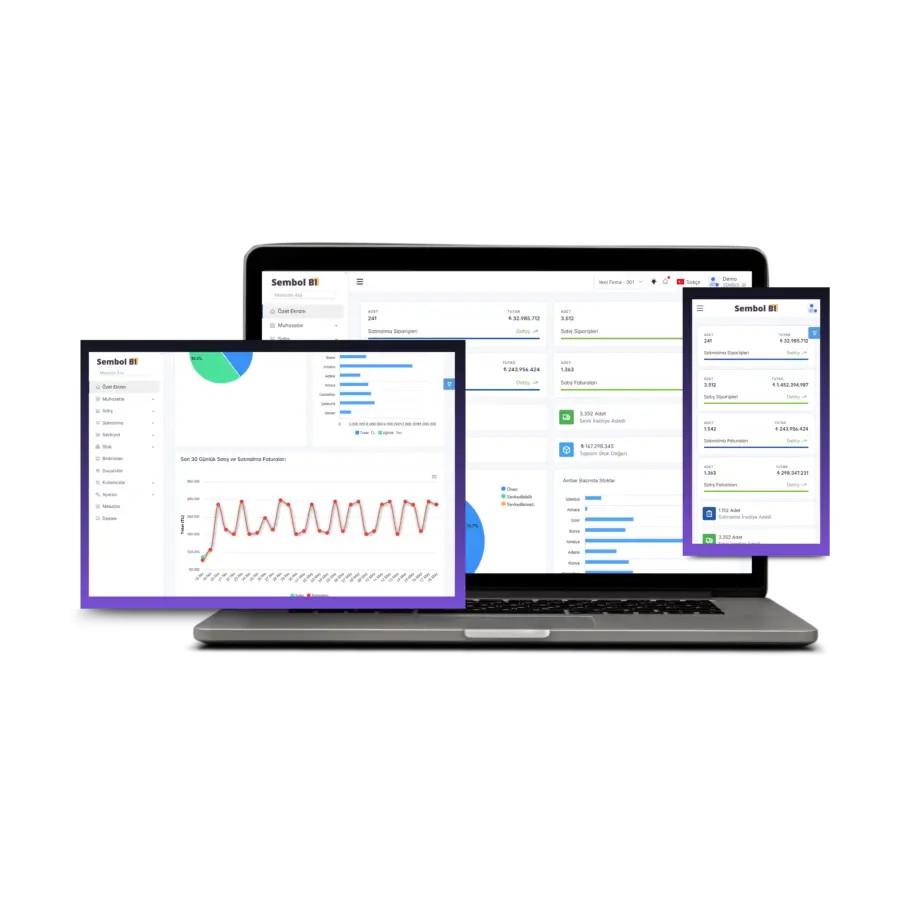
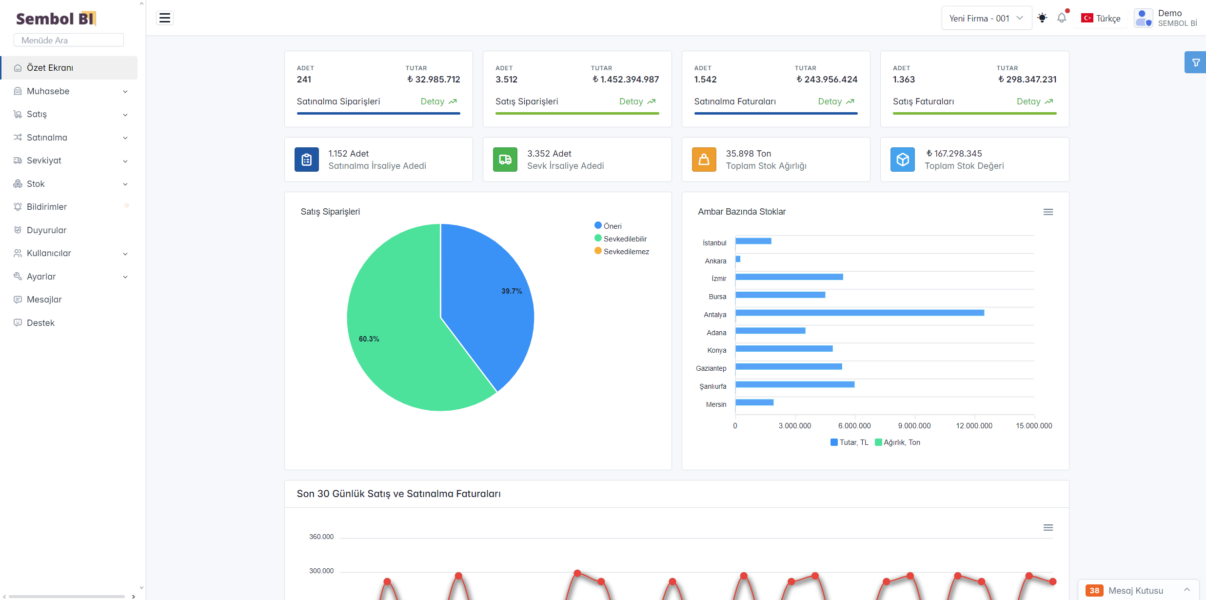
Sembol BI, işletmenizin geleceğini şekillendirmenize yardımcı olacak veri odaklı bir platform sunar. Stratejik kararlarınızı desteklemek için güçlü analiz ve raporlama araçlarına sahip olun.


Sembol BI, veri analizi, raporlama ve iş zekası çözümleri sunarak işletmelerin verilerini anlamalarına, stratejik kararlar almalarına ve rekabet avantajı elde etmelerine yardımcı olur.

İşletmelerin veri varlıklarını en iyi şekilde kullanmalarına yardımcı olmak için, Sembol BI olarak veri analizi ve raporlama süreçlerini basitleştiriyor ve veri yönlü karar almayı teşvik ediyoruz.
Bilgi Alın
Sembol BI, işletmelerin veri varlıklarını en iyi şekilde kullanmalarına yardımcı olarak, operasyonel verimliliği artırma ve rekabet avantajı sağlama konusunda destek olur.
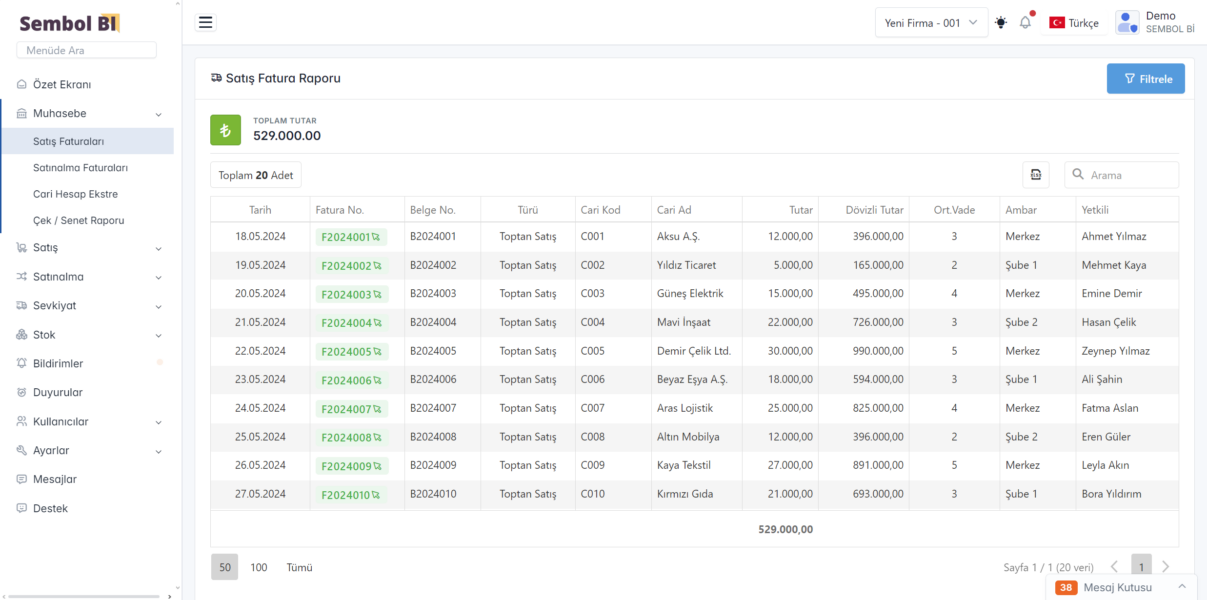
Bize UlaşınBilgileri etkili raporlar halinde sunun. Kararlarınızı destekleyen anlaşılır verilere sahip olun.
Deneyimli ve uzman bir ekip olarak, iş analizi ve raporlama konusundaki derin bilgimizle işletmenizin verilerini etkili bir şekilde yönetiyoruz. Her işletme benzersizdir ve bu nedenle her işletmeye özel çözümler sunarız. İhtiyaçlarınıza ve hedeflerinize uygun özelleştirilmiş analiz ve raporlama çözümleriyle işletmenizin potansiyelini maksimize ediyoruz.

Sembol BI ile verilerinizi kolayca analiz edin, derinlemesine raporlar oluşturun ve iş stratejilerinizi geliştirmek için değerli içgörüler elde edin.

Sembol BI'nın güçlü analiz yetenekleriyle verilerinizi keşfedin, trendleri tanımlayın ve kritik kararlar alın.
Ergen Demir Çelik; Türkiye’de üretilen Demir Çelik mamullerinin yurt içine ve yurt dışına etkin bir şekilde kullanımı için tedariğini yapmak amacı ile kurulmuştur.
MMZ üretim tesisleri Batı Karadeniz kıyısında Düzce, Akçakoca’da yer almaktadır. Üretim tesisleri 78.000 m² açık alanda 38.000 m² kapalı alana kurulmuştur.
İşletmeye ait iş süreçleri incelenir, analiz edilir ve ihtiyaçlar belirlenir.
Raporlama ve analiz gereksinimleri belirlenerek, sistem uygun hale getirilir.
İşletmeler sistem hakkında eğitim verilir ve sisteme entegrasyon sağlanır.
Kullanıcı, sistemdeki raporları inceleyerek işletmenin stratejik kararlarını destekler.


Kantar Entegrasyonu, sanayi işletmelerinde ölçüm ve raporlama süreçlerinin daha hızlı, daha güvenilir

Sanayide Dönüşüm, birçok işletmenin geleceğini şekillendiren güçlü bir süreç hâline geldi. Dijital

Endüstri 4.0, sanayi firmalarının iş yapış şeklini kökten değiştiren güçlü bir dönüşümün

Finansal verimlilik, sanayi firmalarının kaynaklarını daha etkili kullanmasını ve mali performanslarını iyileştirmesini